步驟1:製作
它是什麼?
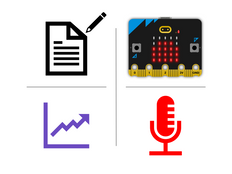
使用新版 micro:bit 的麥克風感測器來測量您周圍的聲音響度,並透過簡單的長條圖顯示。
介紹
編程指引
您將學到什麼
- 如何使用新版 micro:bit 的內建麥克風感測器來測量您周圍環境的聲音強度
- 如何在 LED 螢幕輸出上用圖形來表示輸入感測器的數據
運作方式
- 新版 micro:bit 的麥克風用數字 0 至 255 的數字方式來測量聲音水準。 0 是最安靜的,而 255 則是它能發出的最大的聲音測量。
- 程式碼使用永久循環來持續測量麥克風輸入的聲響,並在 LED 螢幕上繪製長條圖來表示聲響值。
- 測到的聲音越大聲,長條圖就會越高。
你需要的東西
- 新版包含內建聲音功能的 micro:bit(或 MakeCode 模擬器)
- MakeCode 或, Python 編輯器
- 電池組(選配)
步驟2:編碼
1from microbit import *
2
3# function to map any range of numbers to another range
4def map(value, fromMin, fromMax, toMin, toMax):
5    fromRange = fromMax - fromMin
6    toRange = toMax - toMin
7    valueScaled = float(value - fromMin) / float(fromRange)
8    return toMin + (valueScaled * toRange)
9
10# set of images for simple bar chart
11graph5 = Image("99999:"
12               "99999:"
13               "99999:"
14               "99999:"
15               "99999")
16
17graph4 = Image("00000:"
18               "99999:"
19               "99999:"
20               "99999:"
21               "99999")
22
23graph3 = Image("00000:"
24               "00000:"
25               "99999:"
26               "99999:"
27               "99999")
28
29graph2 = Image("00000:"
30               "00000:"
31               "00000:"
32               "99999:"
33               "99999")
34
35graph1 = Image("00000:"
36               "00000:"
37               "00000:"
38               "00000:"
39               "99999")
40
41graph0 = Image("00000:"
42               "00000:"
43               "00000:"
44               "00000:"
45               "00000")
46
47allGraphs = [graph0, graph1, graph2, graph3, graph4, graph5]
48
49# ignore first sound level reading
50soundLevel = microphone.sound_level()
51sleep(200)
52
53while True:
54    # map sound levels from range 0-255 to range 0-5 for choosing graph image
55    soundLevel = int(map(microphone.sound_level(), 0, 255, 0, 5))
56    display.show(allGraphs[soundLevel])
57 步驟3:進階
- 建立您自己來顯示聲音響度的方式,例如根據不同的聲響水準來顯示不同的表情符號
- 製作一個虛擬噪音警報器,僅當聲音超過某個級別時才會閃爍 - 可以使用它來幫助你的課堂保持安靜
This content is published under a Creative Commons Attribution-ShareAlike 4.0 International (CC BY-SA 4.0) licence.


